
Total Fee
Contract safety and distribution are checked. Now check whether the trading activity is real: .

What is Total Fee?
Total Fee is the total cost (in SOL) that all traders have paid on that token. can be faked by bots, but every transaction pays a fee, so fees are harder to fake.
How to check
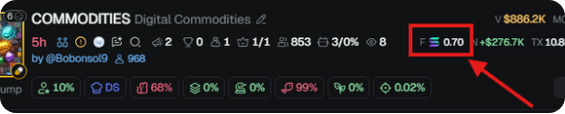
- Open the token on GMGN. Total Fee is in the token header (the Total Fees label, or the F icon in the token info row).
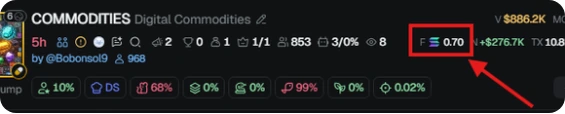
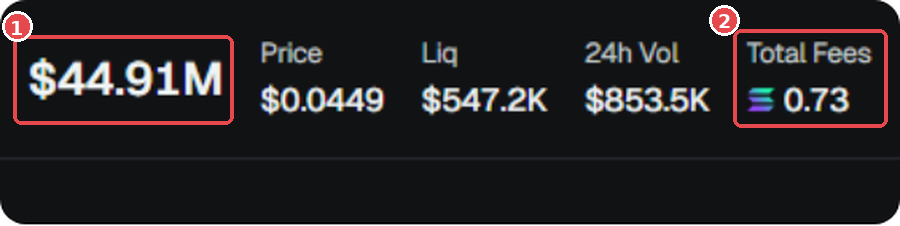
The F icon in the GMGN token info row shows the total fee (example: 0.70 SOL). (Screenshot: GMGN) - Compare it with the market cap (MC). This course's guide: Total Fee around 1 : 10,000 of MC. Example: MC 10k → fee around 1 SOL. This is an estimate, not a hard rule.
Easy way to calculate: MC (in $) ÷ 10,000 ≈ expected Total Fee (in SOL). Example: MC $50K ÷ 10,000 = about 5 SOL.
Exception: on a with really heavy volume at the start (the first few minutes after launch), the 1:10,000 Total Fee guide sometimes doesn't hold, because the numbers haven't settled yet. Don't use Total Fee as your only guide in this phase; also check holders, the bubblemap, and the . - If the fee is far below that guide, be suspicious: MC may have gone up because of just a few (manipulation).
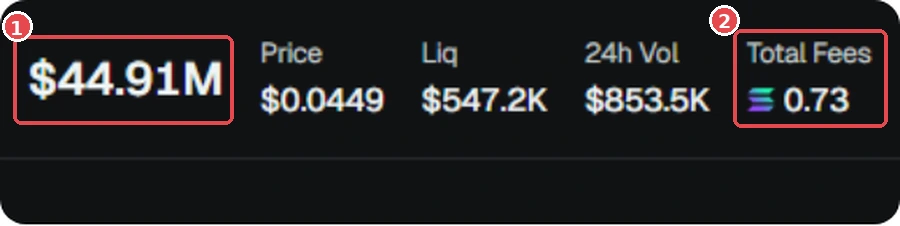
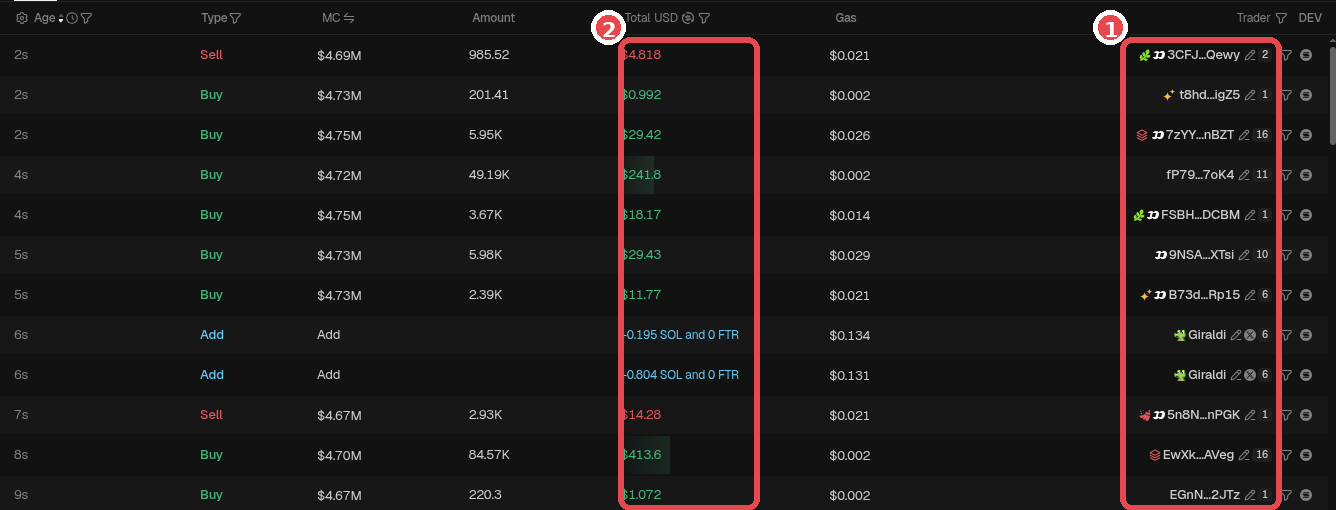
Suspicious example: ① MC $44.91M, but ② Total Fees only 0.73 SOL, far below the 1:10,000 guide. GMGN screenshot (Oct 2026). Token is only an example, not a recommendation. - Also check the Trades tab: are the buyers varied, or is it the same wallets going back and forth?
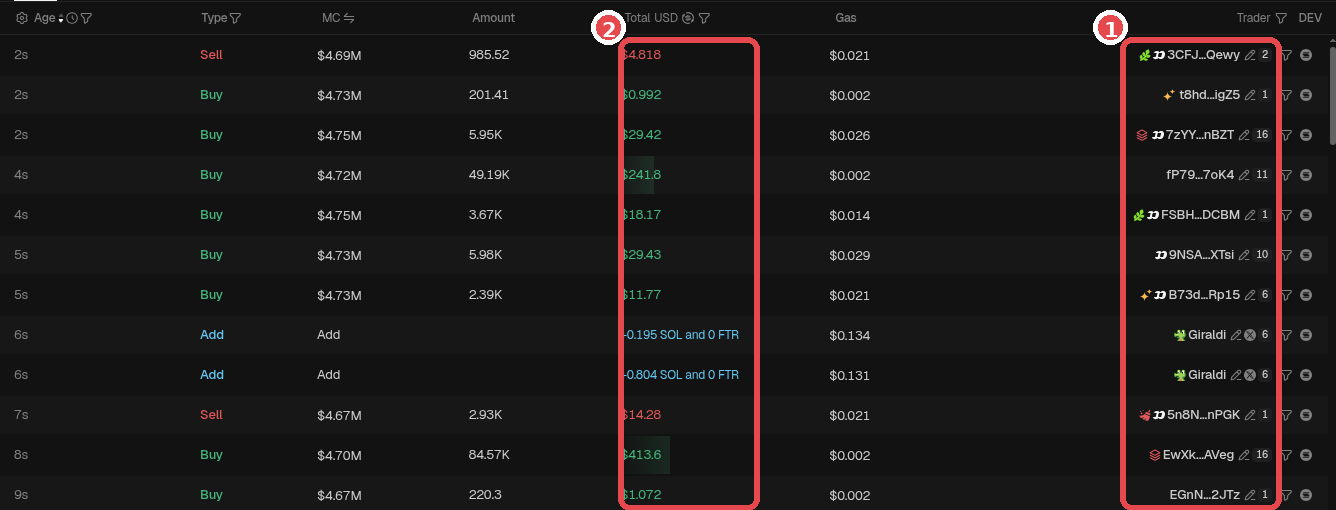
Trades tab on GMGN: ① Trader column (address + label icon), ② Total USD per transaction. Check whether transactions come from many wallets with varied amounts. GMGN screenshot (Oct 2026). Token is only an example, not a recommendation.
Real Example: Staircase Chart + Tiny Total Fee
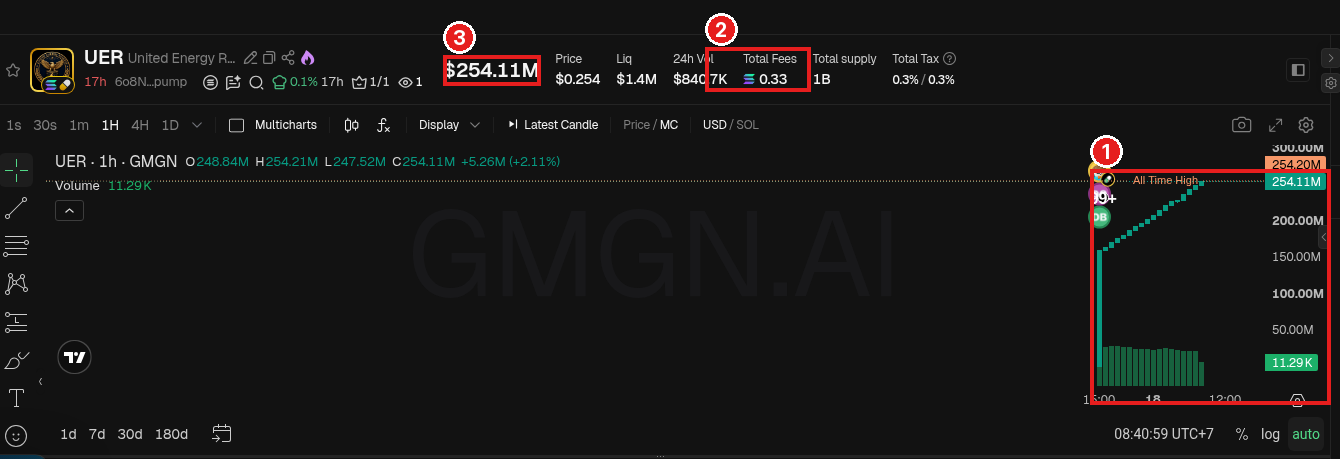
These two tokens (checked Oct 18, 2026) both came from pump.fun and have moved to PumpSwap. Same pattern: the chart climbs like a staircase that's too neat, but the Total Fee is way below the guide. The MC numbers keep changing, so all the numbers below are numbers at the time of checking.
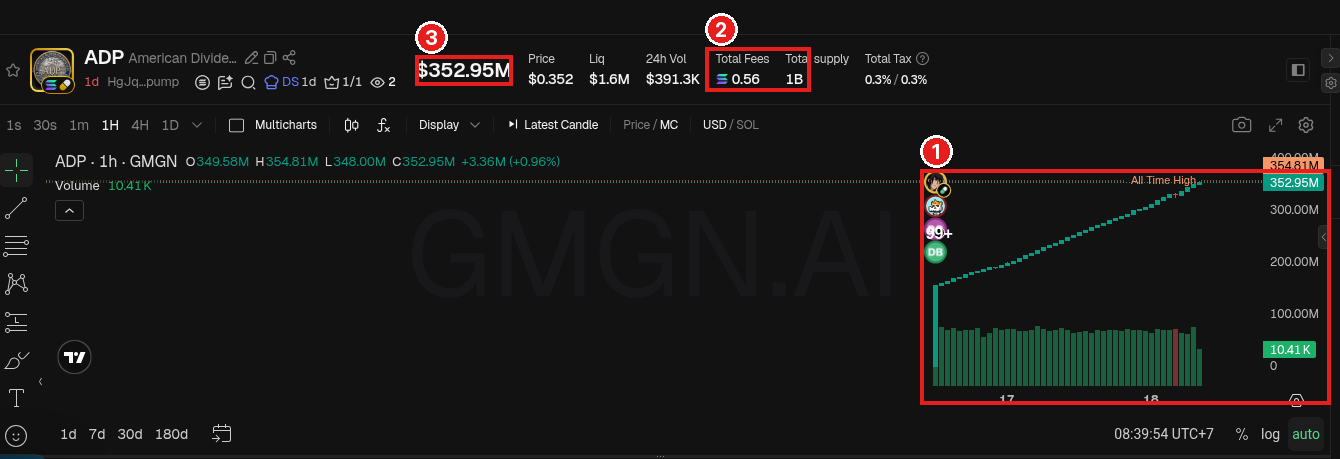
- Calculate with the 1:10,000 guide: ADP's MC of $352.95M → the fee should be around 35,295 SOL. In fact it's only 0.56 SOL, about 63,000x smaller than the guide.
- How can that be? Our guess (not a verdict): the volume is fake volume / from a few wallets. A 24-hour GeckoTerminal data snapshot (checked the morning of Oct 18, 2026, Jakarta time): ADP had about 42,964 buy transactions, but from only 41 unique buyers; UER had about 44,847 buys from 489 buyers. A handful of wallets (likely bots) buy and sell back and forth, the climb neatly, but the fees paid are tiny compared to the MC.
- Why can still be small? On both tokens, Bundler is only 0.4%. Bundler only catches many wallets buying together in one bundle. If the trading comes from a few wallets buying and selling back and forth and not buying together in one bundle, Bundler can still look small. That's why Total Fee + chart shape matter for catching this pattern.
CAs to check yourself: ADP HgJqicqiMReHEgfT1f9N49YKdgkpKshiD4wVxNTBpump, UER 6o8NjyvB7V8uXhxy9XnTMpuLjEfxSjudHhmFwoGGpump.
An MC in the hundreds of millions of dollars doesn't automatically mean the token is big and low . Check the fee first, and remember: what we're after is the smallest possible risk, not because the number is huge.
Green flags & Red flags
Slide the time all the way to the end. Do you think this chart looks normal or suspicious?
Green flags
- Total Fee makes sense compared to MC (around the 1:10,000 guide or more).
- Transactions from many wallets with varied amounts.
Red flags
- Big MC but a tiny fee.
- Transactions with the same pattern (same amounts, same intervals): signs of a bot.
Summary
- Total Fee = the total cost all traders have paid on that token. Harder to fake than volume.
- The course's guide: MC (in $) ÷ 10,000 ≈ Total Fee (in SOL). It's an estimate, and in the first few minutes of a new pair it sometimes doesn't hold yet.
- A fee far below the guide = suspect fake volume (the ADP and UER examples). Skip or be careful, then move on to checking the token's socials and profile. A small fee = bigger manipulation risk, not a price prediction: when checked, the ADP and UER charts were actually still going up.
Common mistakes
- Believing a big MC = low risk, without checking the fee.
- Thinking a small Bundler means the volume is real. Wash trading from a few wallets can slip past Bundler.
- Using Total Fee as the only guide in the first few minutes of a new pair.
Volume can be faked, and greed can fool you too. Make sure the risk is as small as possible before you enter.
Next up, lesson 2.11: .
Not financial advice.
Progress is saved in this browser.