
Chart Reading Basics for Degens
This lesson is very basic: how to read , , support/, and . The goal isn't to predict the price, but to help you decide where to get in, where you're wrong, and when to get out (lesson 3.9).

Candles
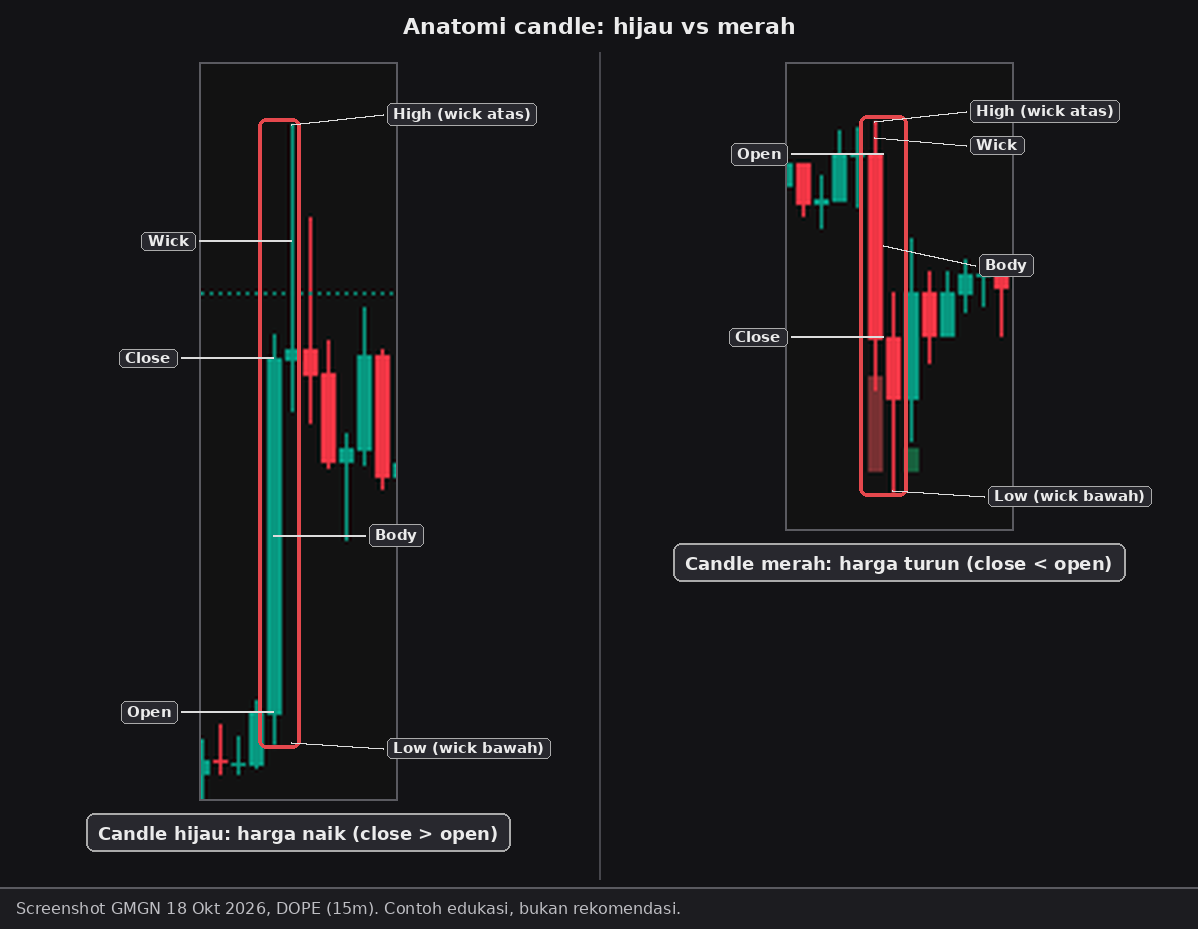
- One candle = the price movement within one time range (for example 1 minute).
- The candle body: from the opening price (open) to the closing price (close). Usually green if it closed higher than it opened (up), red if it closed lower (down).
- The wicks above and below the body: the highest (high) and lowest (low) price touched in that range.
- In this course we often use MC () as the price reference, for example support at 10K to 20K MC (lesson 3.6).
Illustration (made-up numbers): a 1-minute candle opens at 20K MC, goes up to 26K, then closes at 22K. The candle is green (it closed above the open), but it has a long upper wick: the price reached 26K and then fell back before that candle closed.
Timeframes
- Timeframe = the time range of each candle: 1m, 5m, 15m, 1h, and so on.
- Small timeframes (1m, 5m) show detail, good for new tokens and fast trades. Lesson 3.5 uses 1m/5m to find in the candle before a .
- Big timeframes show the broader direction. A newly launched token doesn't have many candles on big timeframes yet.
- A common habit: look at a bigger timeframe first for context, then go down to a small timeframe to find an .
Support & Resistance
- Support = a "floor" area: the price dropped there several times and then bounced back up (lesson 3.6).
- Resistance = the opposite, a "ceiling" area: the price went up there several times, got stuck, and fell back.
- How to spot them: look for areas touched several times (at least 2, lesson 3.6). Treat them as an area, not one exact number.
- Use them for your plan (lesson 3.9): entry near support, if support breaks, take partial profit near resistance.
- Support can break and resistance can be broken through. Bouncing twice doesn't mean it'll bounce a third time (lesson 3.6). Support/resistance are areas of probability, not a guarantee the price will bounce or break through.
Illustration (made-up numbers): the price bounced three times around 15K MC, and got stuck twice around 30K MC. Support ≈ 15K, resistance ≈ 30K. The plan: entry near 15K, cut loss if it breaks below and doesn't come back, take partial profit near 30K.
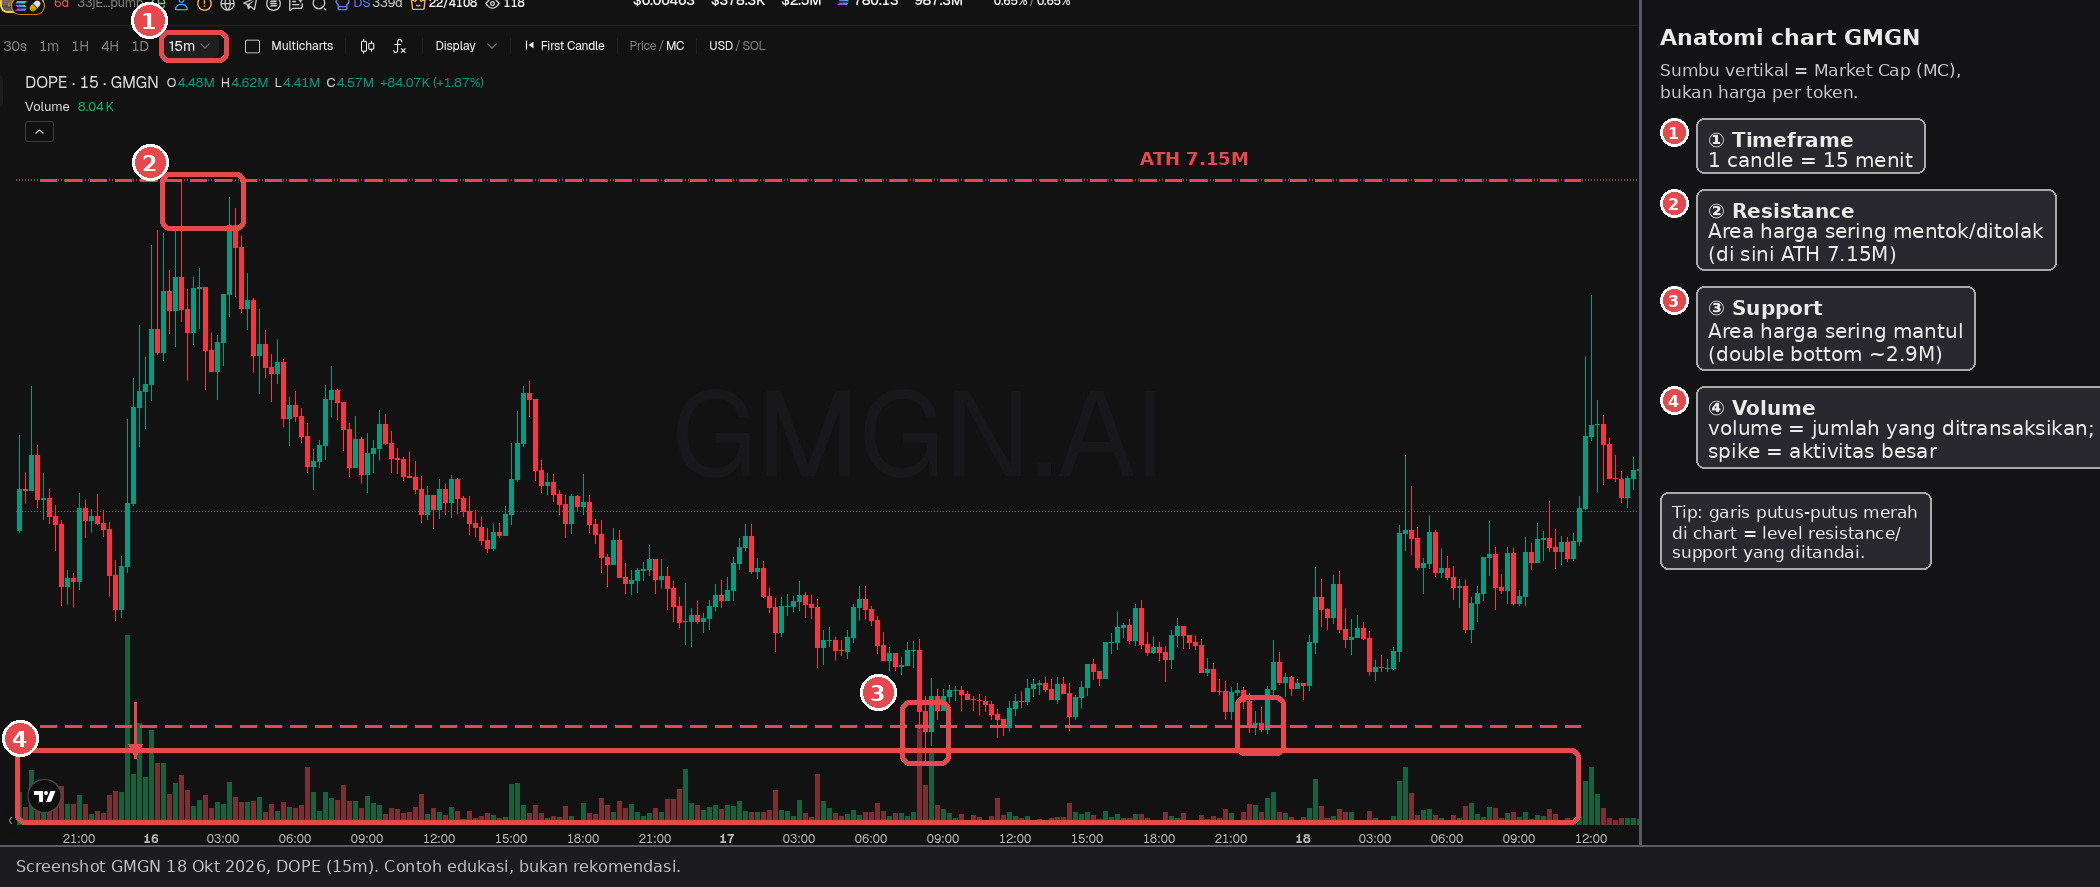
A real example (token DOPE, 15m): in the image below, ① the selected timeframe (15m), ② resistance around the MC of 7.15M, ③ support around 2.9M MC, touched twice (a ), and ④ a at the bottom of the chart. The vertical axis on GMGN's chart is MC, not the price per token.
Volume
- Volume = how much of the token was traded in each candle. On many charts, volume shows up as bars at the bottom (④ on the DOPE chart above).
- A price rise with big volume is often read as lots of people buying in. A price rise with small volume is often read as a thin move that can easily reverse.
- Volume can be faked. Check vs MC (lesson 2.10) and the transaction pattern in the Trades tab. Heavy volume ≠ low (lesson 3.7).
- A big red candle with high volume? Check who's selling: the dev, bundlers, or big (lessons 2.5, 2.8)?
Patterns That Have Already Come Up in This Course
- : going up too neatly without normal pullbacks = suspect fake volume (lessons 2.10, 2.12).
- Pump then dump: the GOY and DOTS examples in lesson 1.1, down about 89% and 93% from their ATH.
- "Woke up": flat () for a long time, then a sudden pump. This is the wallet hunting moment in lesson 3.5.
- Green all the way with no red candles, and only 1 or 2 wallets selling = suspect you can't sell (lesson 2.2).
Summary
- A candle shows the open, close, high, and low within one timeframe. Green usually means up, red usually means down.
- Support = floor, resistance = ceiling. Use them as areas for planning your entry, cut loss, and , not as a price promise.
- Volume shows how busy it is, but it can be faked. Check Total Fee and the Trades tab.
Common mistakes
- Reading the chart first without checking the token's safety in Chapter 2.
- Assuming support or a certain pattern will definitely work.
- Believing big volume = a healthy token, without checking for fake volume.
A green chart easily gets your greed going. Remember, what we're after is the smallest possible risk: use the chart to set your limits, not to chase candles.
Next up, lesson 3.12: Mindset: FOMO, Revenge Trades, and When to Stop.
Not financial advice.
Progress is saved in this browser.