
Chapter 2 · Basics: Check a Token Before You BuyLesson 9 of 16
2.9
Bubblemaps
± 4 min read 7 sections 5 images
Top 10 only gives you a number. A bubble map shows you the picture: who the big are and whether they're connected to each other.

Section 1 / 7
What is a Bubble map?
- One bubble = one holder, and its size = the amount of tokens held.
- Colored bubbles connected by arrows = that have transferred to each other. A group like this is called a .
On GMGN, the bubble map is already on the token page (a panel from InsightX, with tabs InsightX | Faster100X). No need to open another site.
Section 2 / 7
How to check
- On the GMGN token page, click the Bubble icon (two circles) at the far right of the Holders/Trades tab row (rightmost, after the other buttons in that row).

The Bubble icon (red box) at the far right of the tab row on the GMGN token page. (Screenshot: GMGN) - The bubble map panel opens inside GMGN.
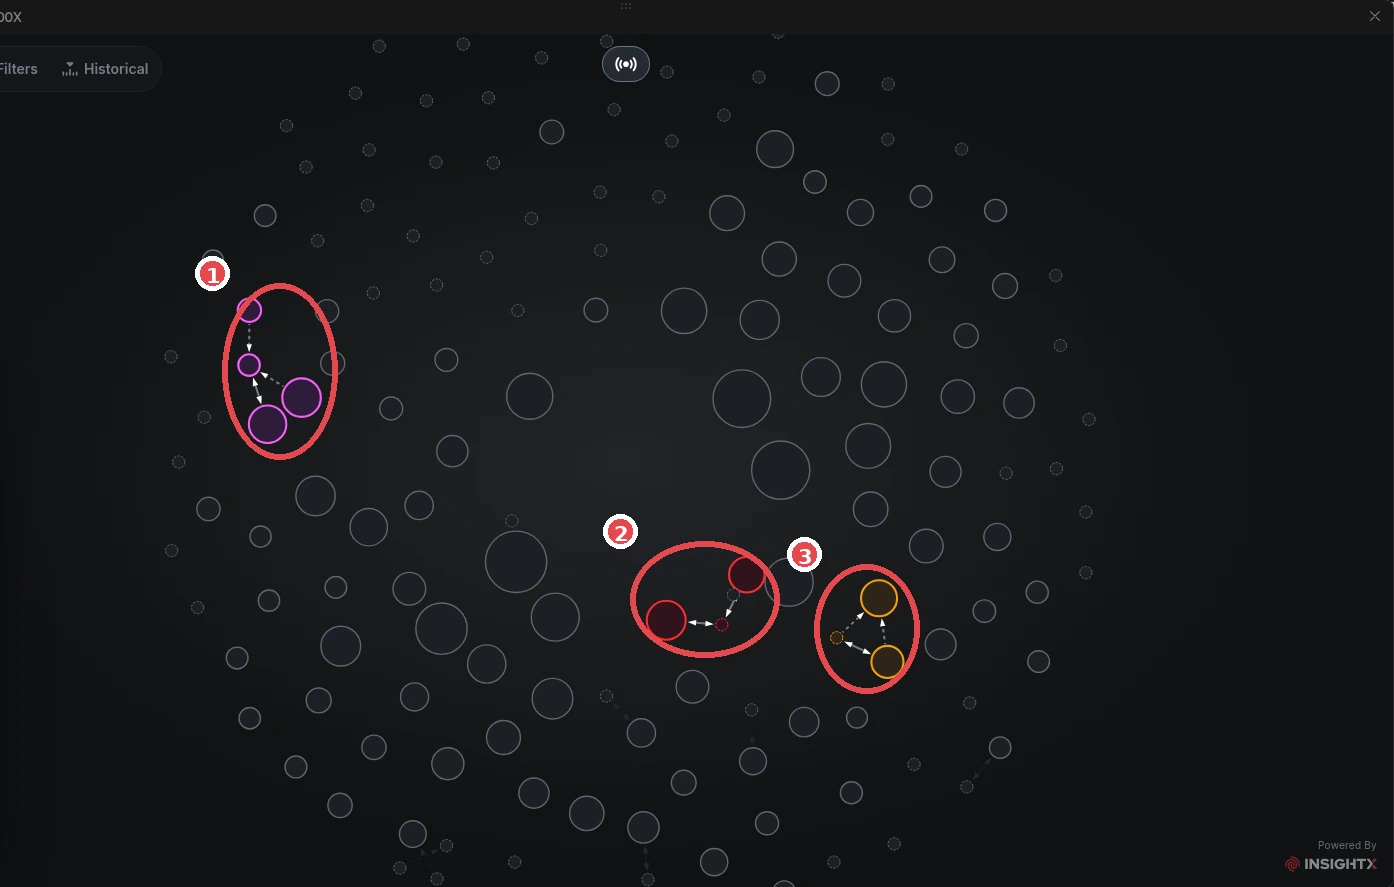
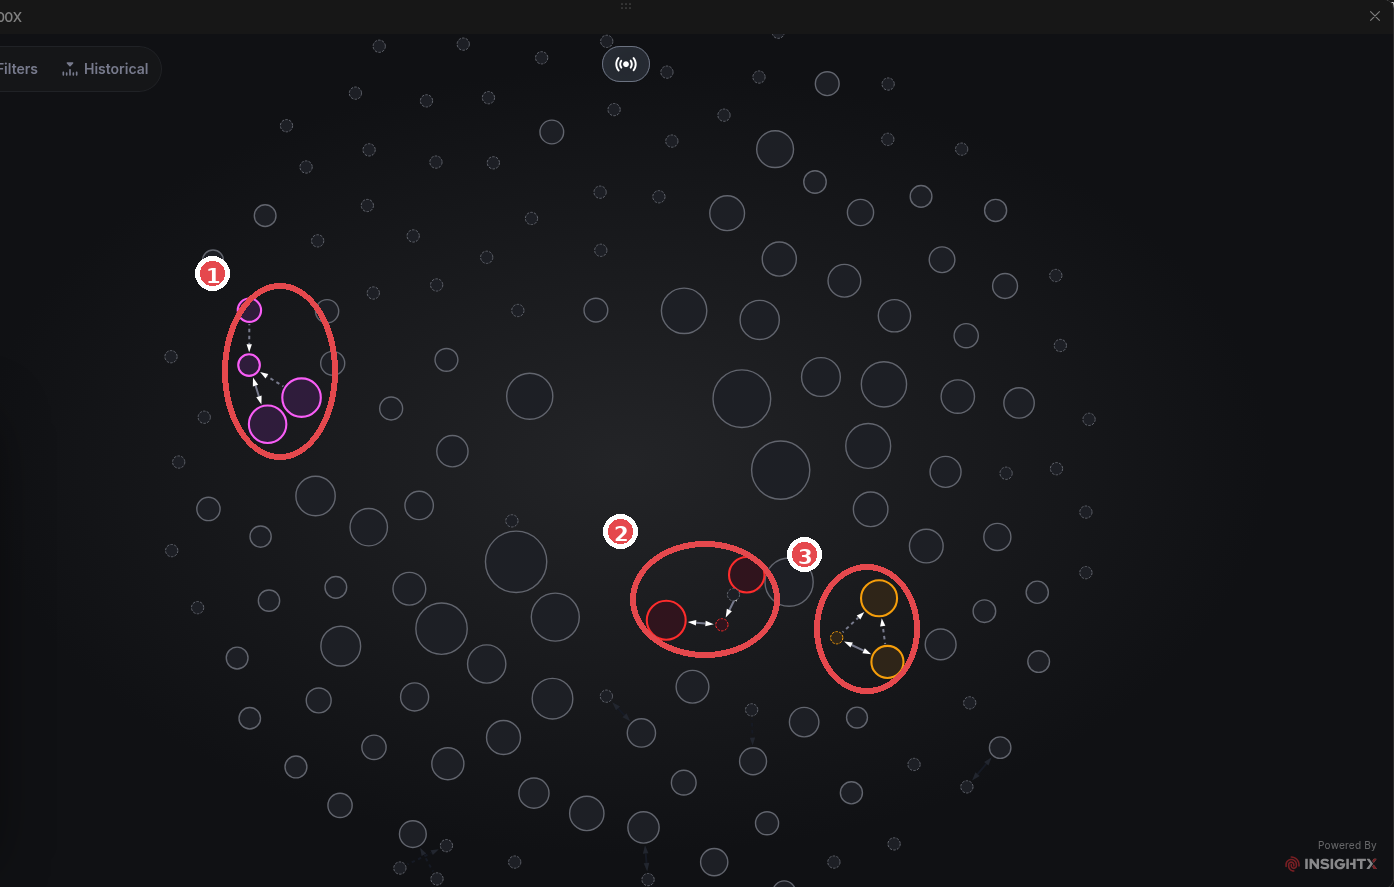
GMGN bubble map (example token FTR, InsightX data): red circles ①②③ = small colored clusters linked to each other. One cluster can be one person/group, but not necessarily, so check first. GMGN screenshot (Oct 2026). Token is only an example, not a recommendation. - How to read it:
- Gray, not connected = fine.
- Colored and connected by arrows = wallets linked to each other (possibly one owner). Add up the percentage they hold.

Section 3 / 7
How Clusters Are Detected (and Why They Can Be "Wrong")
- Wallets get detected as a cluster if they've interacted (transferred to each other at some point) and then all bought the same token. They don't have to have the same owner.
- Example chain: wallet A once sent to B, B to C, C to D, D to E (A → B → C → D → E). These five wallets could belong to 5 different people. But if all five buy the same token, the bubble map still shows them as one cluster.
- The difference from multi-wallet / : there, one person really does hold many wallets (lessons 2.8 and 3.5). A cluster only says "these wallets have been connected", not necessarily one person.
- So a cluster is a signal, not a verdict. Look at the context: are they connected through an exchange or not, is their from the same source at a similar time or not (lesson 2.6), and did they buy together in the same block (lesson 2.8).
The cluster detection explanation is summarized from a post by @Seonasol.
Section 4 / 7
What cluster percentage is dangerous?
- There's no fixed number, it depends on the level you set for yourself.
- How to think about it: look at the biggest cluster's percentage, then ask yourself, "if this cluster sells everything, am I ready for that?" Example: there's a 5% cluster. If you're ready to get dumped on by that 5% of , entering is fine; if you're not, you can skip it.
- A rough guide (the author's estimate from experience, not a rule): clusters below 5% are lower risk, 5 to 10% be careful, above 10% high risk.
Section 5 / 7
Green flags & Red flags
Green flags
- Most bubbles are gray, and any clusters are small.
Red flags
- One big cluster holds a significant share of supply.
- A cluster linked to the 's wallet.
Section 6 / 7
The bubblemaps.io version (optional)
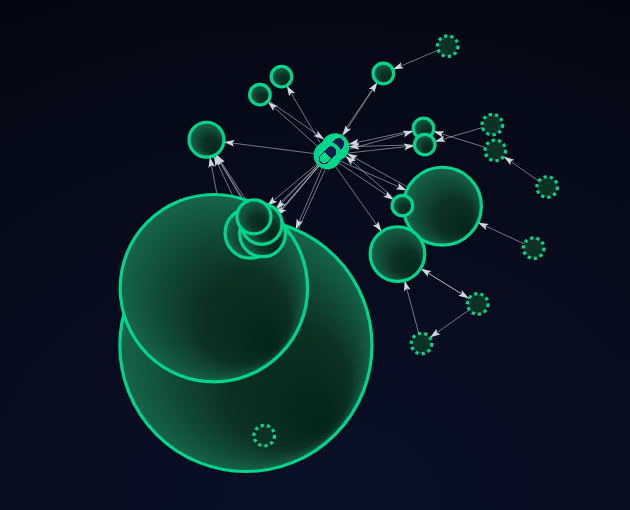
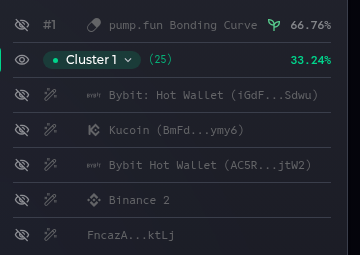
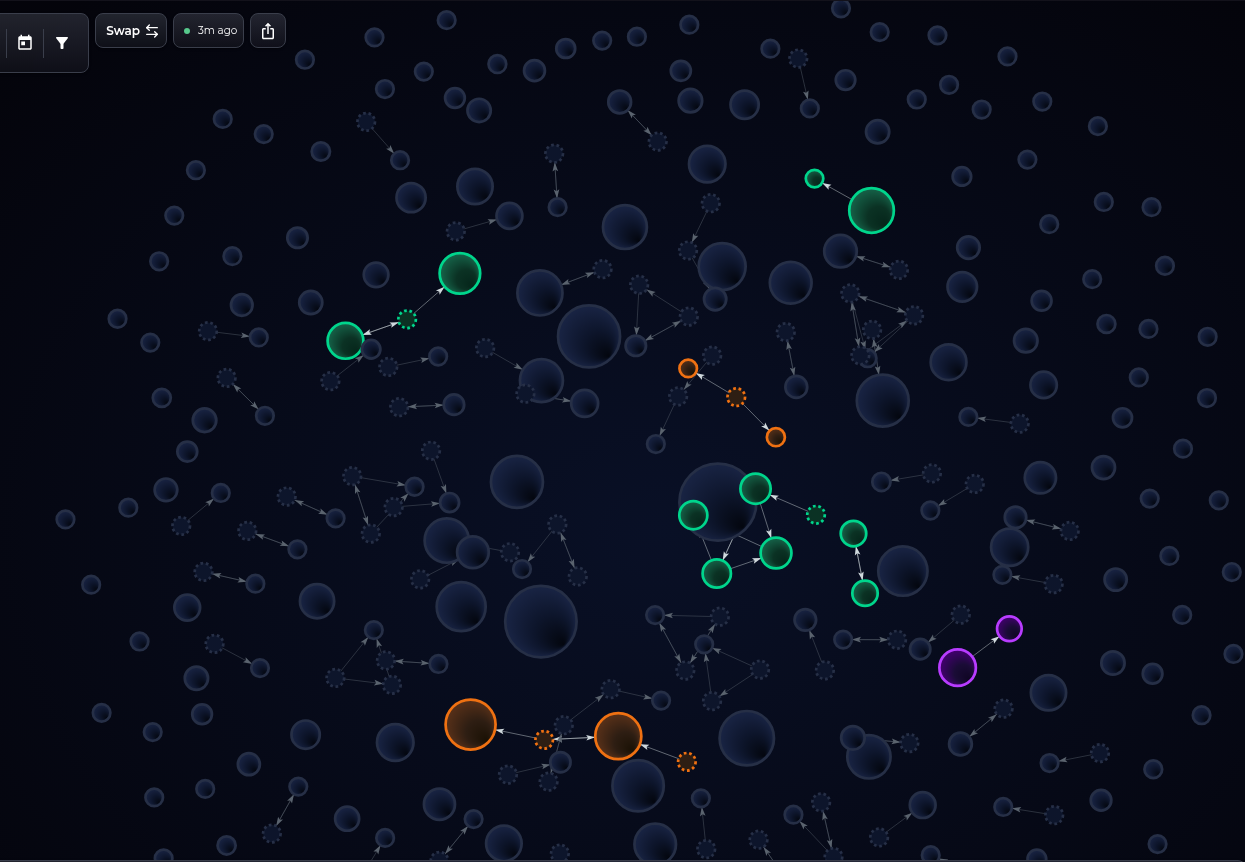
Summary
Summary
Summary
- Bubble map: one bubble = one holder. Colored bubbles connected by arrows = a cluster (wallets that have transferred to each other).
- Open it with the Bubble icon on the GMGN token page, then add up the percentage held by the cluster.
- The author's rough guide (not a rule): clusters below 5% low risk, 5 to 10% medium risk, above 10% high risk. The bigger the cluster, the bigger the risk if they sell together. A big cluster doesn't mean the token can't , and a clean map is no guarantee it goes up either.
Section 7 / 7
Common mistakes
- Thinking a cluster must be one owner. It can be different people, or connected through an exchange.
- Only looking at the Top 10 number without opening the bubble map.
- Forgetting to ask yourself: "if this cluster sells everything, am I ready for that?"
Big cluster = big risk. Look for the smallest risk, don't get carried away by greed just because the chart is green.
Next up, lesson 2.10: .
Not financial advice.
Progress is saved in this browser.